
New Yukon tourism data dashboard launched today! 
 Super nice work by Brett and Geof and the Tourism and Culture crew! https://yukon.ca/en/statistics-and-data/tourism-statistics-and-reports/access-yukon-tourism-indicators-dashboard #opendata #dataviz #Yukon


")


 New blog post about data art!
  What is data-driven art?
 Why do people make data art?
 It includes an example using
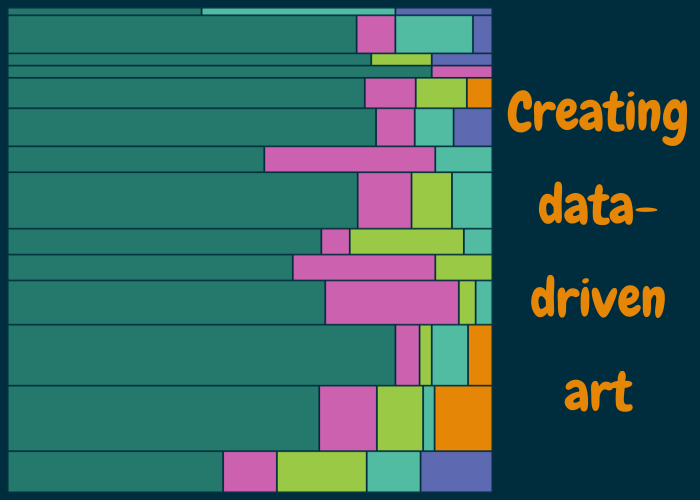


 D'Arcy Norman